

Project Gerbera
- Annual Cash Yield
- 14.6% - 17.4%
- Investment Duration
- 6-8 years
- Total Investment Size
- US$ 31 - 63 Mio.
- Levered IRR
- 12,6% - 17,4%
- SPC Owners / Asset Manager
- 3rd party equity investors / FPG AIM Capital Pte. Ltd. ("FAC")
- Investment Model
- Direct Project SPC Investment (Tokenized SPC)
Key Highlight
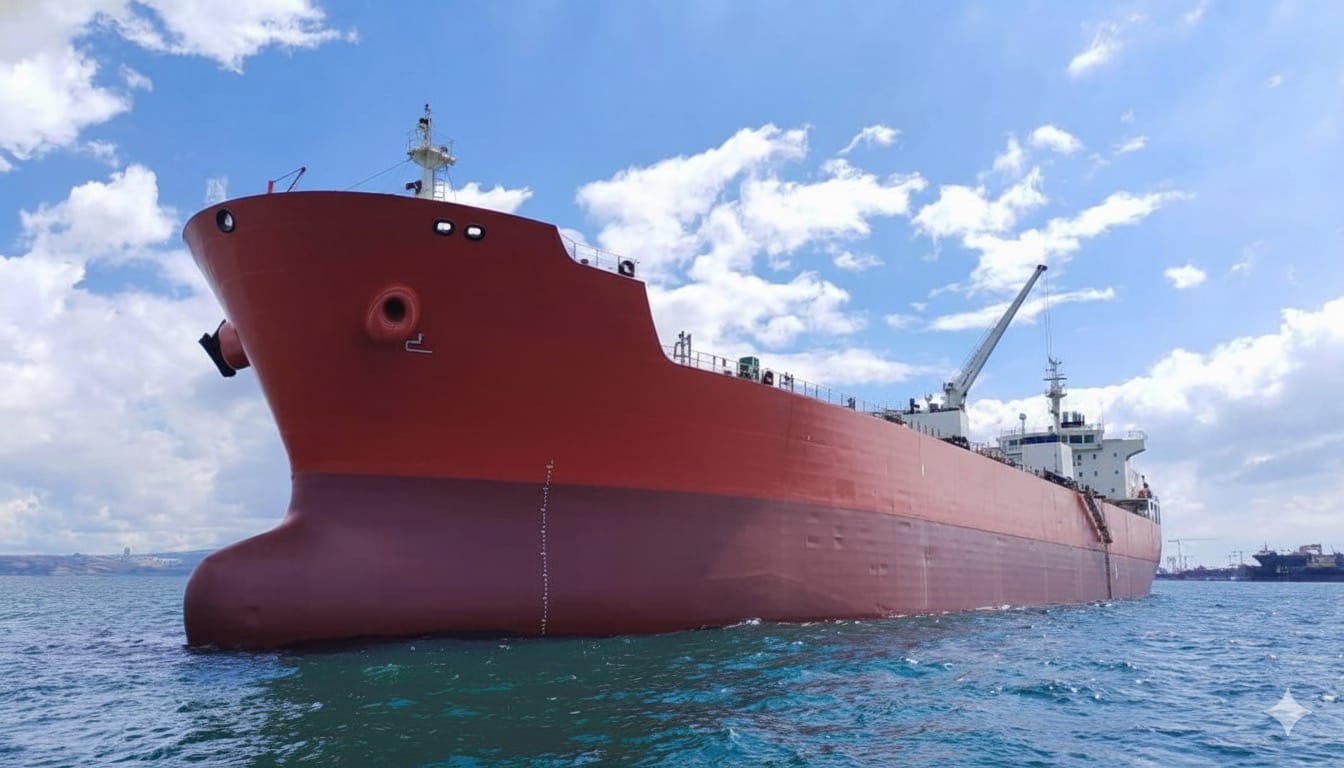
Project Gerbera offers an investment opportunity to acquire 2 – 4 x 2007/2008 Japanese-built 19,900DWT high-quality stainless-steel chemical tankers which are positioned to capture strong earnings potential over the next 6 – 8 years and expecting to achieve levered IRR in excess of 12%
Opportunity Background
- We have been approached by Womar Logistics (on behalf of vessel owners Easterly Asset Management), to identify qualified buyers for 4 x J19 Stainless Steel (“SS”) Chemical Tankers – either on individual vessels basis or en bloc basis
- The vessels are currently operating in the Womar Stainless Steel Chemical Tankers Pool earning c. USD 17,500 net per day
- Womar, headquartered in Singapore, is one of the leading chemical tankers pool managers in the world
- FPG AIM SIMS is arranging a project with external investors to acquire 2 – 4 of these vessels with the aim of continuing to operate in the Womar pool
Investment Snapshot
- Total gross investment : USD 31 – 63 million (2 – 4 vessels)
- Expected base case levered IRR : 12.6% – 17.4% basis 50% leverage with competitive debt terms
- Estimated average annual cash yield : 14.6% – 17.4%
Transactions Highlight
- Strategic asset positioning through a sophisticated pool mechanism to optimize vessel utilization and capture value
- Stable underlying market fundamentals expected to bolster earnings and tighten the supply / demand balance
- Disciplined structure with conservative leverage (50% LTV) to minimize cash breakeven levels and protect investors
Transaction Structure
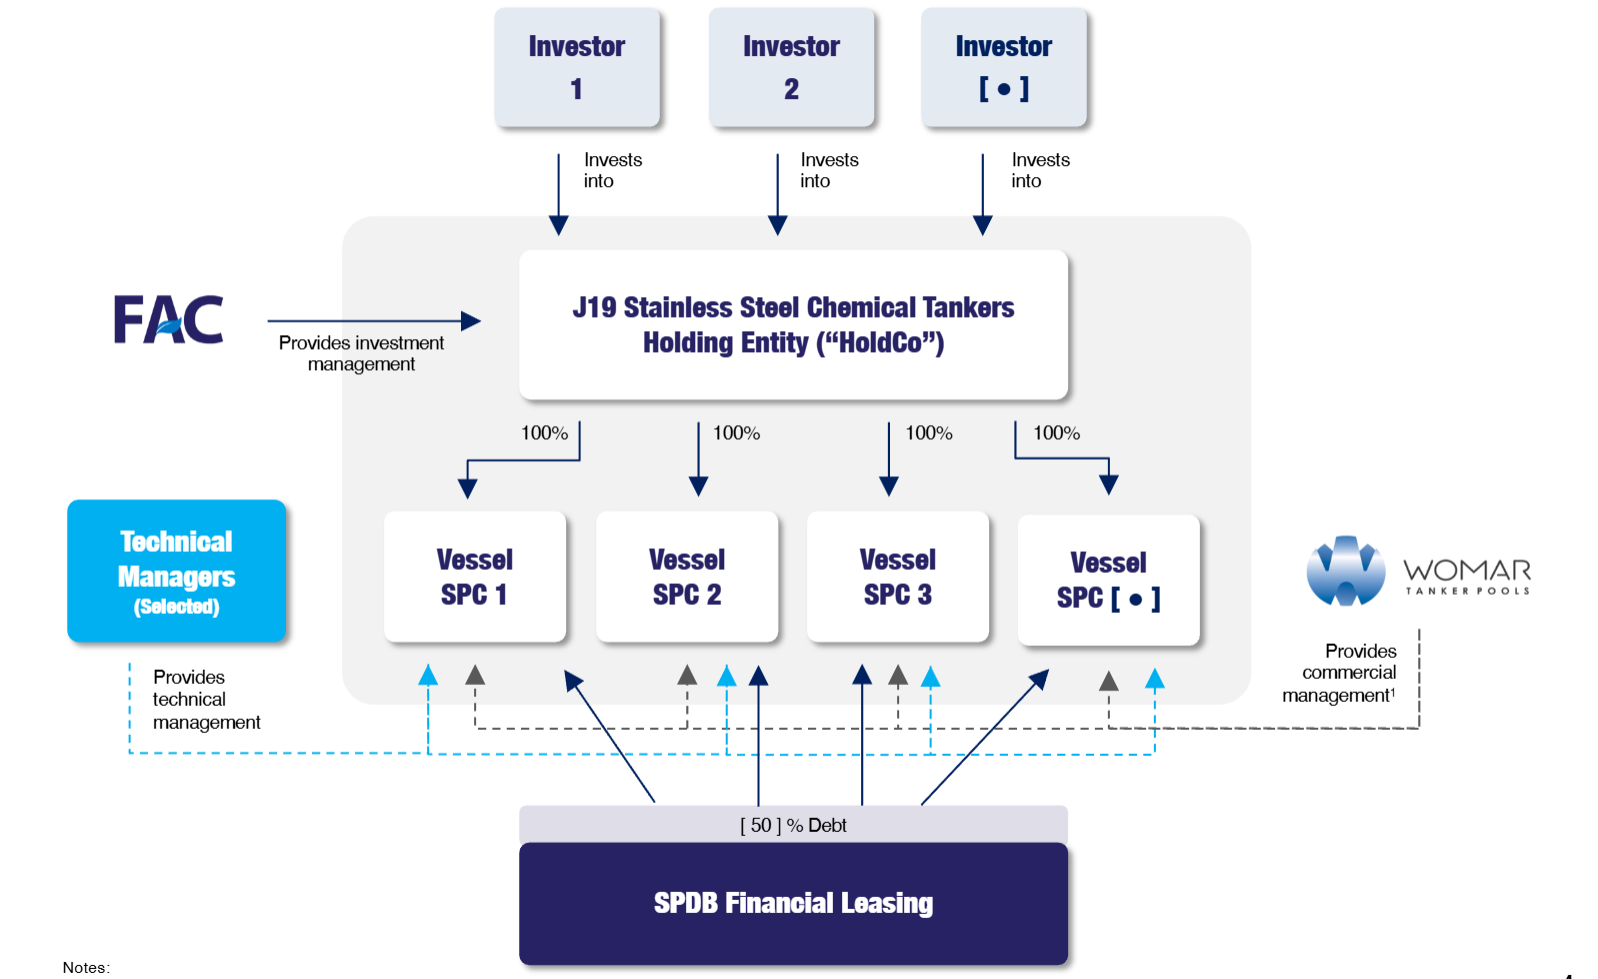
Note: Womar to act as a commercial manager if vessels are placed in their pool; third parties may manage if vessels are on time charter
Transaction Economics
Key Investment Terms
| SPC Owners / Asset Manager | 3rd party equity investors / FPG AIM Capital Pte. Ltd. ("FAC") |
| SPC Incorporation | Singapore |
| Investment Duration | 6 - 8 years |
| Investor Exit Strategy | Asset disposal upon target IRR achieved |
| Total Investment Size | USD 31 – 63 Million based on 2 – 4 vessels |
| Senior Debt Terms | LTV of 50 % @ base SOFR 3.75 % + margin 3.0 % on a non recourse senior secured basis |
| Total Equity Investment | USD 16 – 33 Million based on 2 – 4 vessels |
| Base Case Equity IRR (Levered) | 12.6 - 17.4 % |
| Structuring Fee | 1.0 % based on vessel price payable to arrangers |
| Investment Management Fee | 0.7 % on vessel acquisition price per annum payable to asset manager |
Vessels
| Vessel Name | Year Built | Target Price |
|---|---|---|
| Easterly Beech Galaxy | 2007 | USD 15.5 Million |
| Easterly AS Olivia | 2007 | USD 15.5 Million |
| Easterly AS Omaria | 2007 | USD 15.5 Million |
| Easterly Lime Galaxy | 2008 | USD 16.5 Million |
Overview of Target Returns
| Vessels | BEECH GALAXY | AS OLIVIA | AS OMARIA | LIME GALAXY |
|---|---|---|---|---|
| Built Date | Jan 2007 | Jul 2007 | Nov 2007 | Dec 2008 |
| Target Acquisition Price | USD 15.5m | USD 15.5m | USD 15.5m | USD 16.5m |
| Operational Period | 6 years | 6.5 years | 6.75 years | 8 years |
| Expected TCE Rate/ Vessel | USD 16,500 / day for 1st 2 years; USD 15,840 / day thereafter | |||
| Daily Opex/ Vessel | USD 6,300 / day with 2% inflation p.a. | |||
| Drydock | USD 0.8m every 2.5 years, USD 1.25m every 5 years | |||
| Exit | USD 5.0m (scrap value) at vessel age 25 years | |||
| Avg Cash Breakeven Rates | USD 10,313/ day | USD 10,144/ day | USD 10,069/ day | USD 10,003/ day |
| Equity Investment | USD 8.0m | USD 8.0m | USD 8.0m | USD 8.5m |
| Equity IRR | 12.6% | 15.9% | 17.4% | 15.5% |
Sensitivity Analysis (TC Rate)
| Vessels | BEECH GALAXY | AS OLIVIA | AS OMARIA | LIME GALAXY | ||
|---|---|---|---|---|---|---|
| NET TC Rate(USD/ Day) | Low | 14,500 | (0.1)% | 2.8% | 4.1% | 3.6% |
| 15,500 | 6.1% | 9.2% | 10.6% | 9.5% | ||
| Base | 16,500 | 12.6% | 15.9% | 17.4% | 15.5% | |
| 17,500 | 19.2% | 22.7% | 24.4% | 21.7% | ||
| High | 18,500 | 26.0% | 29.9% | 31.6% | 27.9% | |
Market Outlook
Project Gerbera Investment Rationale
- Significant upside potential in asset values due to low newbuilding orderbook for J19s
- Strong underlying fundamentals on the demand side with industrial outputs forecast to grow by 2%
- Conservatively structured with low leverage resulting in low cash breakeven rates of c.USD10,000 p.d.
- Leading stainless steel chemical tanker pool operators in the world ensuring maximum profitability
- Vessels known for its flexibility, as the workhorses of the chemical tanker industry
- Downside protection via scrapping in a worse case scenario given the age of vessels
Chemical Trade Market Outlook - Demand
Resilient Global and Regional Growth with Structural Tailwinds for Derived Demand
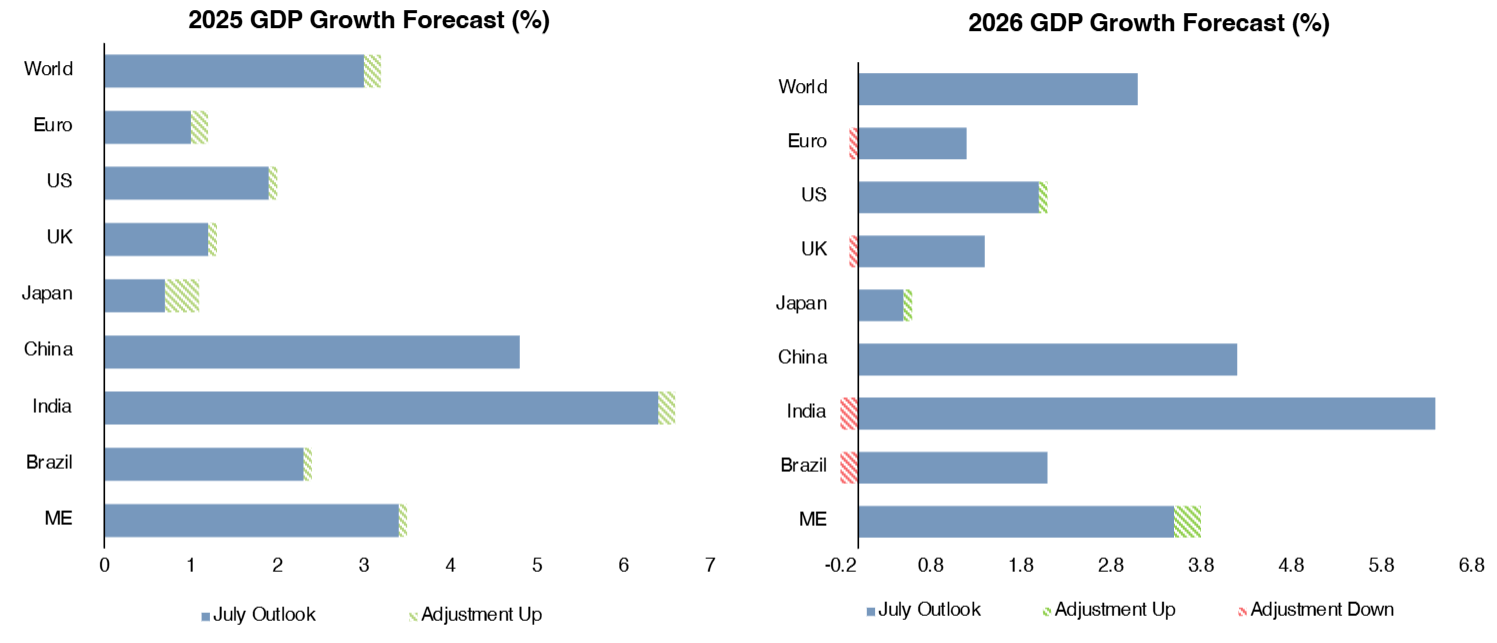
- Significant upward revisions to GDP growth from July forecasts, with an overall 0.2 percentage point increase in 2025 estimates, while 2026 world projections remain unchanged
- Advanced economies are witnessing tailwinds in diminishing tariff uncertainty and easing fiscal and labor market conditions, while emerging markets' expansion will be driven by robust domestic demand and strong government stimulus
- Near-perfect correlation of 0.9 with GDP growth translates to steady growth projections for global chemical trade demand
Stable Global Chemical Trade Volumes
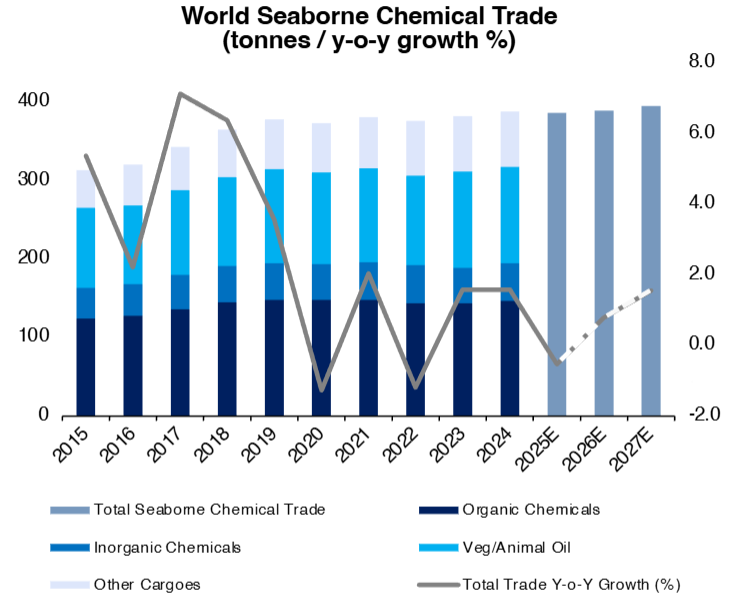
- Resilient import demand in inorganic chemicals and edible oil segments, projected at 7.5% and 6% into 2029
- Seaborne chemical trade growth projected to pick up in 2026, driven by a rebound in feedstock demand and more stable trade policy environment
Stable Global Chemical Trade Volumes
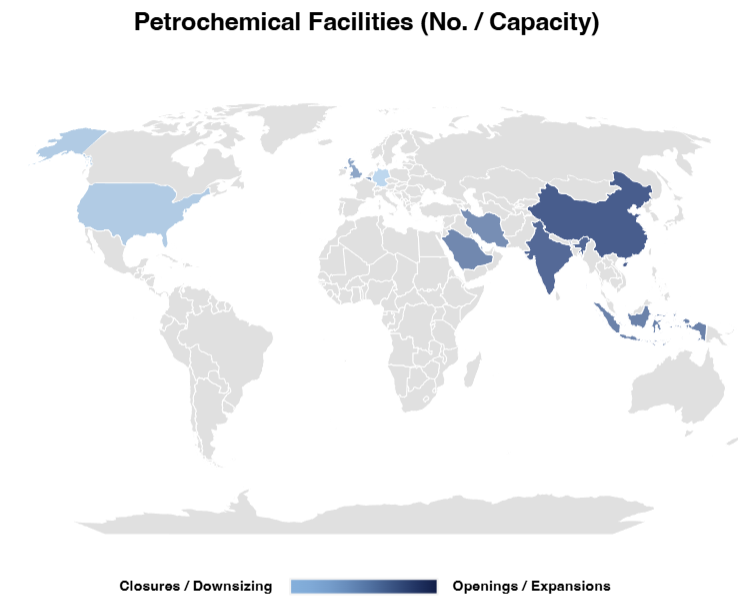
- Petrochemical facility closures in US and EU have largely been replaced with openings in Asia and Middle East
- Increased voyage times with trade rerouting expected to boost ton-mile demand in the near term, as new ME / Asia capacity brings future vessel repositioning
Chemical Trade Market Outlook - Supply
Aging fleet leaving core trades
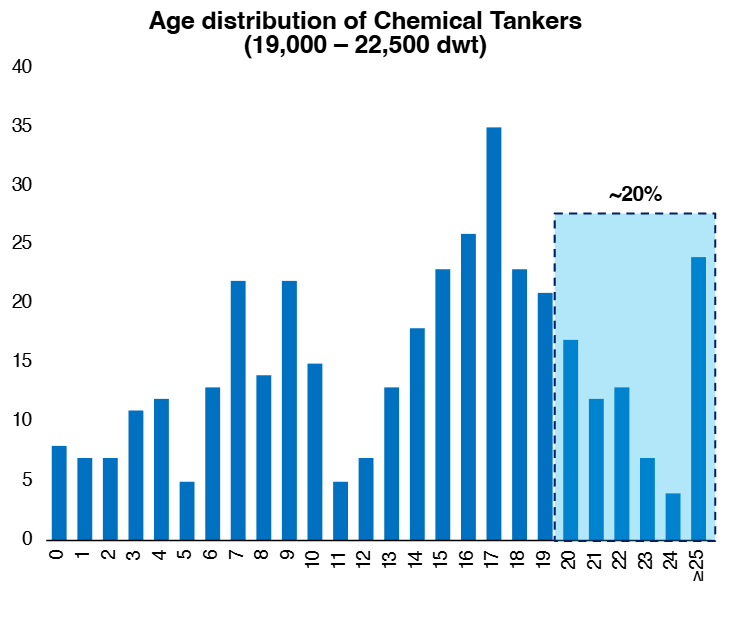
- The J19 chemical tanker fleet is aging significantly, with an average age of approximately 13.8 years
- Nearly half of the fleet is more than 15 years old, and ~20% will surpass the 20-year mark by end-25, tightening the medium-term supply outlook
Older tonnage face scrapping pressure
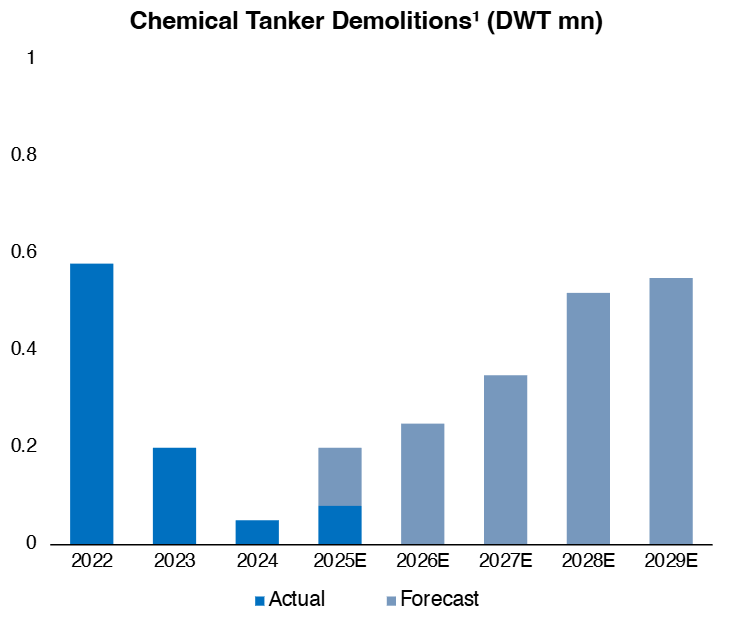
- Scrapping rates have picked up in 2025, and is projected to grow steadily to 2022 levels by 2029
- This reduces the overall supply of available tonnage, contributing to higher earnings for remaining old vessels in operation
Structural Rebalancing with Modest Growth
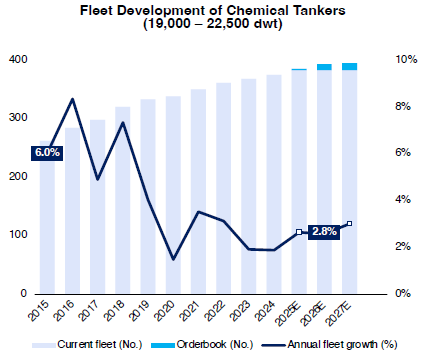
- This segment is seeing a declining growth trajectory, with annual fleet growth falling from 6.0% in 2015 to a projected 2.8% in 2025 – 2027
- Demand growth will soon outpace fleet expansion, creating supply bottlenecks and pushing up charter rates
Low Orderbook-to-Fleet Ratio
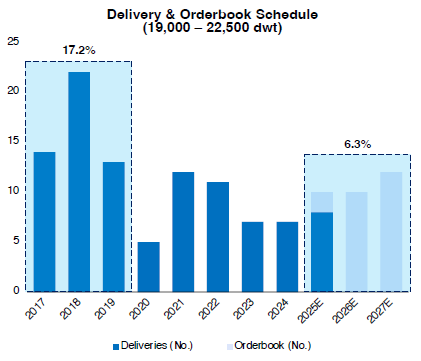
- Relatively low orderbook-to-fleet ratio of 6.2%, compared to ~17.2% during 2017–2019
- Muted contracting activity, with newbuild prices up ~30% since 2020 and limited yard availability over the next two years
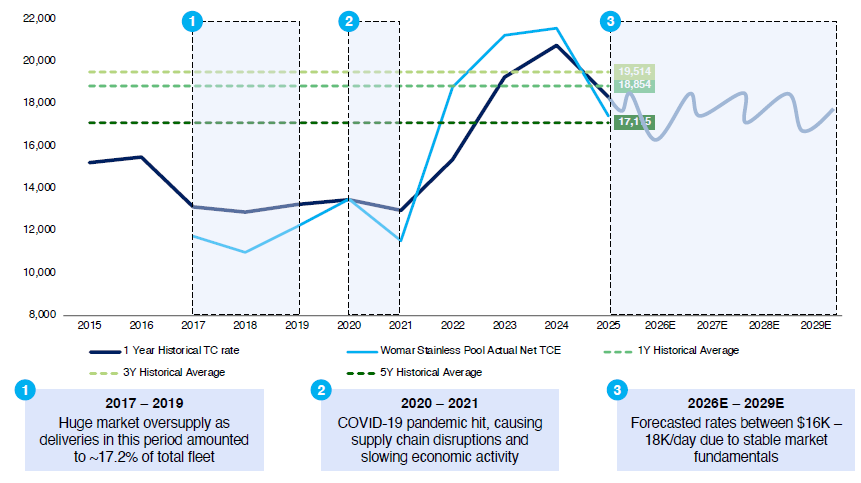
20K DWT SS Chemical Tankers 1-Year Timecharter Rates
TC rates normalizing from exceptional 2022-2024 highs but well above long-term averages, reflecting cautious optimism
Overview of Womar Logistics Pte. Ltd.
Company Overview
Womar Logistics Pte. Ltd. (“Womar”) is a leading tanker pool operator, managing a fleet of 54 chemical tankers (10,000 – 40,000 dwt) across 4 shipping pools
- Extensive network of established shipowners, charterers and broker houses
- Global commercial management expertise and excellent profitability track record
- State-of-the-art IT infrastructure provides members transparent, real-time access to pool performance
Established in 2009 as a 50 / 50 joint venture between Heidmar and W-O Shipping Group, Womar was later acquired by Clear Ocean Partners in 2019
- Clear Ocean Partners (formerly: FDX Offshore), is a US maritime finance boutique firm backed by former GE Capital CEO Denis Nayden
Womar's fleet of 41 stainless steel tankers confers a competitive advantage in the chemical market
- Equipped with chemical compatibility and flexibility to serve complex trades
Shipping Pool Arrangement
- Strategic asset positioning through a sophisticated pool mechanism to optimize vessel utilization and capture value
- Stable underlying market fundamentals expected to bolster earnings and tighten the supply / demand balance
- Disciplined structure with conservative leverage (50% LTV) to minimize cash breakeven levels and protect investors
The Womar Tanker Pool provides pure-play stainless steel chemical exposure through an investor-friendly structure:
- Shipowners: Retain ownership of vessels without establishing internal commercial departments, and focus on asset play
- Charterers: Capitalize on Womar's substantial Contract of Affreightment (COA) portfolio and strong pool partner network
- Investors: Direct market exposure to shipping market returns without the complexities of vessel ownership and operations
Womar's Chemical Tanker Pools
- Coated and stainless steel IMO II, 10–15,000 DWT chemical tankers
- Equipped with bow thrusters, 13–20 segregations and nitrogen generators or inert gas systems
- Worldwide chemical and oil trade

- Stainless steel IMO II, 19–27,000 DWT chemical tankers
- Equipped with bow thrusters, 16–36 segregations and nitrogen generators or bottled N2 capacity
- Worldwide chemical and oil trade

- Coated IMO II, 25–30,000 DWT chemical tankers
- Equipped with bow thruster, 12–18 segregations and nitrogen generators
- Trading mainly chemicals and CPP in Europe as well as worldwide chemical and oil

- Coated IMO II, 24–40,000 DWT chemical tankers
- 12–18 segregations with nitrogen generators or inert gas systems
- Trading CPP in Europe as well as worldwide chemical and oil
Strong Pool Partnerships
Diversified Contract Network
Disclaimer
This analysis was prepared by FPG AIM SIMS (“SIMS”). While SIMS has used all reasonable skill and care in the creation and supply of this analysis, SIMS makes no representation or warranty regarding, nor does it accept any responsibility for, the accuracy or completeness of any information originating from third parties and used in the preparation of this analysis, or the creditworthiness or ability of any party referred to in the analysis to complete the transaction referred to or the advisability of entering into or not entering into, as the case may be, the transaction which is the subject to the review request, it being unconditionally and irrevocably agreed and acknowledged that any decision to enter into or not to enter into the transaction referred to in this analysis is a matter solely within the discretion of the recipient of this analysis.
The information provided in our presentation is collated from both publicly available data (e.g., annual reports, websites and media releases) and data provided from third party services. In many instances, the opinion expressed in this presentation is our current opinion based on the current market trends and is subject to change from time to time. The information in our presentation should be interpreted as an indicative guidance only.